What Am I Doing?
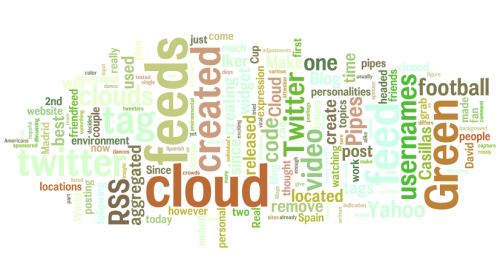
Since creating the two tag clouds for green tweeters and the blogs of green tweeters, I have been thinking about other ways of visualizing the data. What I wanted to to do was create a chart or table from the feed data but I was unsuccessful in locating a tool to do this.
Last weekend I came across this article, which discusses manipulating rss data in Google Spreadsheets. I then remembered an article by Digital Inspiration that outlined the steps for using Google Spreadsheets as a feed reader. I decided to manipulate the rss data within Google spreadsheets and try to make charts using the green tweeter data.
How I Created It
First, I would like to say that this is probably an extremely inefficient way to obtain this data and I would appreciate tips on other methods in the comments. I did, however, learn a lot about Google Spreadsheets, spreadsheet formulas and using charts and gadgets. In an earlier article, I pointed out that I was not proficient with Yahoo Pipes. I am even less accomplished with excel, scalc, and Google Spreadsheets functions. My methods may be convoluted but what I learned was valuable.

